CompStats.metrics


CompStats.metrics aims to facilitate performance measurement (with standard errors and confidence intervals) and statistical comparisons between algorithms on a single problem, wrapping the different scores and loss functions found on metrics.
To illustrate the use of CompStats.metrics, the following snippets show an example. The instructions load the necessary libraries, including the one to obtain the problem (e.g., digits), four different classifiers, and the last line is the score used to measure the performance and compare the algorithm.
>>> from sklearn.svm import LinearSVC
>>> from sklearn.naive_bayes import GaussianNB
>>> from sklearn.ensemble import RandomForestClassifier
>>> from sklearn.datasets import load_digits
>>> from sklearn.model_selection import train_test_split
>>> from sklearn.base import clone
>>> from CompStats.metrics import f1_score
The first step is to load the digits problem and split the dataset into training and validation sets. The second step is to estimate the parameters of a linear Support Vector Machine and predict the validation set’s classes. The predictions are stored in the variable hy.
>>> X, y = load_digits(return_X_y=True)
>>> _ = train_test_split(X, y, test_size=0.3)
>>> X_train, X_val, y_train, y_val = _
>>> m = LinearSVC().fit(X_train, y_train)
>>> hy = m.predict(X_val)
Once the predictions are available, it is time to measure the algorithm’s performance, as seen in the following code. It is essential to note that the API used in metrics is followed; the difference is that the function returns an instance with different methods that can be used to estimate different performance statistics and compare algorithms.
>>> score = f1_score(y_val, hy, average='macro')
>>> score
<Perf(score_func=f1_score, statistic=0.9521, se=0.0097)>
The previous code shows the macro-f1 score and, in parenthesis, its standard error. The actual performance value is stored in the attributes statistic and se
>>> score.statistic, score.se
(0.9521479775366307, 0.009717884979482313)
Continuing with the example, let us assume that one wants to test another classifier on the same problem, in this case, a random forest, as can be seen in the following two lines. The second line predicts the validation set and sets it to the analysis.
>>> ens = RandomForestClassifier().fit(X_train, y_train)
>>> score(ens.predict(X_val), name='Random Forest')
<Perf(score_func=f1_score)>
Statistic with its standard error (se)
statistic (se)
0.9720 (0.0076) <= Random Forest
0.9521 (0.0097) <= alg-1
Let us incorporate another predictions, now with Naive Bayes classifier, and Histogram Gradient Boosting as seen below.
>>> nb = GaussianNB().fit(X_train, y_train)
>>> score(nb.predict(X_val), name='Naive Bayes')
>>> hist = HistGradientBoostingClassifier().fit(X_train, y_train)
>>> score(hist.predict(X_val), name='Hist. Grad. Boost. Tree')
<Perf(score_func=f1_score)>
Statistic with its standard error (se)
statistic (se)
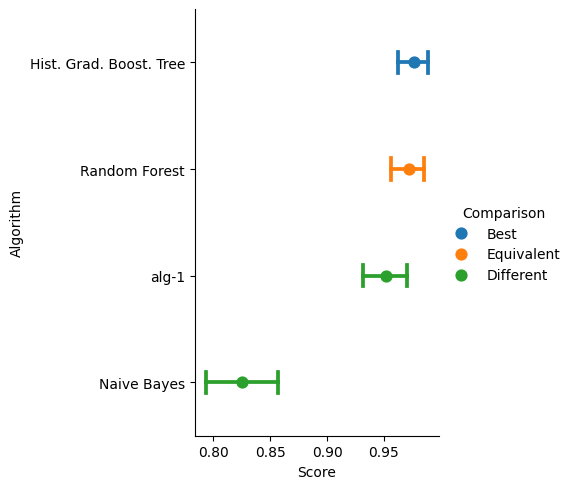
0.9759 (0.0068) <= Hist. Grad. Boost. Tree
0.9720 (0.0076) <= Random Forest
0.9521 (0.0097) <= alg-1
0.8266 (0.0159) <= Naive Bayes
The performance, its confidence interval (5%), and a statistical comparison (5%) between the best performing system with the rest of the algorithms is depicted in the following figure.
>>> score.plot()
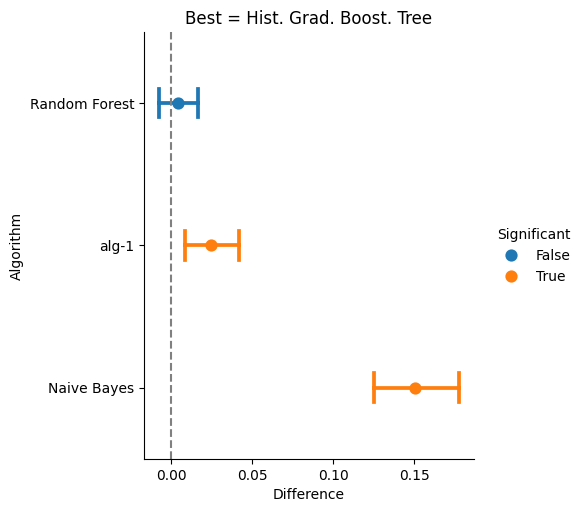
The final step is to compare the performance of the four classifiers, which can be done with the difference method, as seen next.
>>> diff = score.difference()
>>> diff
<Difference>
difference p-values  w.r.t Hist. Grad. Boost. Tree
0.0000 <= Naive Bayes
0.0100 <= alg-1
0.3240 <= Random Forest
The class Difference has the plot method that can be used to depict the difference with respectto the best.
>>> diff.plot()
- accuracy_score(y_true, *y_pred, normalize=True, sample_weight=None, num_samples: int = 500, n_jobs: int = -1, use_tqdm=True, **kwargs)[source]
Perfwithaccuracy_scoreasscore_func.The parameters not described can be found inaccuracy_score.- Parameters:
y_true (numpy.ndarray or pandas.DataFrame) – True measurement or could be a pandas.DataFrame where column label ‘y’ corresponds to the true measurement.
y_pred (numpy.ndarray) – Predictions, the algorithms will be identified with alg-k where k=1 is the first argument included in
y_pred.kwargs (numpy.ndarray) – Predictions, the algorithms will be identified using the keyword
num_samples (int) – Number of bootstrap samples, default=500.
n_jobs (int) – Number of jobs to compute the statistic, default=-1 corresponding to use all threads.
use_tqdm (bool) – Whether to use tqdm.tqdm to visualize the progress, default=True
accuracy_score
- balanced_accuracy_score(y_true, *y_pred, sample_weight=None, adjusted=False, num_samples: int = 500, n_jobs: int = -1, use_tqdm=True, **kwargs)[source]
Perfwithbalanced_accuracy_scoreasscore_func.The parameters not described can be found inbalanced_accuracy_score.- Parameters:
y_true (numpy.ndarray or pandas.DataFrame) – True measurement or could be a pandas.DataFrame where column label ‘y’ corresponds to the true measurement.
y_pred (numpy.ndarray) – Predictions, the algorithms will be identified with alg-k where k=1 is the first argument included in
y_pred.kwargs (numpy.ndarray) – Predictions, the algorithms will be identified using the keyword
num_samples (int) – Number of bootstrap samples, default=500.
n_jobs (int) – Number of jobs to compute the statistic, default=-1 corresponding to use all threads.
use_tqdm (bool) – Whether to use tqdm.tqdm to visualize the progress, default=True
balanced_accuracy_score
- top_k_accuracy_score(y_true, *y_score, k=2, normalize=True, sample_weight=None, labels=None, num_samples: int = 500, n_jobs: int = -1, use_tqdm=True, **kwargs)[source]
Perfwithtop_k_accuracy_scoreasscore_func.The parameters not described can be found intop_k_accuracy_score.- Parameters:
y_true (numpy.ndarray or pandas.DataFrame) – True measurement or could be a pandas.DataFrame where column label ‘y’ corresponds to the true measurement.
y_score (numpy.ndarray) – Predictions, the algorithms will be identified with alg-k where k=1 is the first argument included in
y_pred.kwargs (numpy.ndarray) – Predictions, the algorithms will be identified using the keyword
num_samples (int) – Number of bootstrap samples, default=500.
n_jobs (int) – Number of jobs to compute the statistic, default=-1 corresponding to use all threads.
use_tqdm (bool) – Whether to use tqdm.tqdm to visualize the progress, default=True
top_k_accuracy_score
- average_precision_score(y_true, *y_score, average='macro', sample_weight=None, num_samples: int = 500, n_jobs: int = -1, use_tqdm=True, **kwargs)[source]
Perfwithaverage_precision_scoreasscore_func.The parameters not described can be found inaverage_precision_score.- Parameters:
y_true (numpy.ndarray or pandas.DataFrame) – True measurement or could be a pandas.DataFrame where column label ‘y’ corresponds to the true measurement.
y_score (numpy.ndarray) – Predictions, the algorithms will be identified with alg-k where k=1 is the first argument included in
y_pred.kwargs (numpy.ndarray) – Predictions, the algorithms will be identified using the keyword
num_samples (int) – Number of bootstrap samples, default=500.
n_jobs (int) – Number of jobs to compute the statistic, default=-1 corresponding to use all threads.
use_tqdm (bool) – Whether to use tqdm.tqdm to visualize the progress, default=True
average_precision_score
- brier_score_loss(y_true, *y_proba, sample_weight=None, pos_label=None, num_samples: int = 500, n_jobs: int = -1, use_tqdm=True, **kwargs)[source]
Perfwithbrier_score_lossaserror_func.The parameters not described can be found inbrier_score_loss.- Parameters:
y_true (numpy.ndarray or pandas.DataFrame) – True measurement or could be a pandas.DataFrame where column label ‘y’ corresponds to the true measurement.
y_proba (numpy.ndarray) – Predictions, the algorithms will be identified with alg-k where k=1 is the first argument included in
y_pred.kwargs (numpy.ndarray) – Predictions, the algorithms will be identified using the keyword
num_samples (int) – Number of bootstrap samples, default=500.
n_jobs (int) – Number of jobs to compute the statistic, default=-1 corresponding to use all threads.
use_tqdm (bool) – Whether to use tqdm.tqdm to visualize the progress, default=True
brier_score_loss
- f1_score(y_true, *y_pred, labels=None, pos_label=1, average='binary', sample_weight=None, zero_division='warn', num_samples: int = 500, n_jobs: int = -1, use_tqdm=True, **kwargs)[source]
Perfwithf1_scoreasscore_func.The parameters not described can be found inf1_score.- Parameters:
y_true (numpy.ndarray or pandas.DataFrame) – True measurement or could be a pandas.DataFrame where column label ‘y’ corresponds to the true measurement.
y_pred (numpy.ndarray) – Predictions, the algorithms will be identified with alg-k where k=1 is the first argument included in
y_pred.kwargs (numpy.ndarray) – Predictions, the algorithms will be identified using the keyword
num_samples (int) – Number of bootstrap samples, default=500.
n_jobs (int) – Number of jobs to compute the statistic, default=-1 corresponding to use all threads.
use_tqdm (bool) – Whether to use tqdm.tqdm to visualize the progress, default=True
f1_score
- log_loss(y_true, *y_pred, normalize=True, sample_weight=None, labels=None, num_samples: int = 500, n_jobs: int = -1, use_tqdm=True, **kwargs)[source]
Perfwithlog_lossaserror_func.The parameters not described can be found inlog_loss.- Parameters:
y_true (numpy.ndarray or pandas.DataFrame) – True measurement or could be a pandas.DataFrame where column label ‘y’ corresponds to the true measurement.
y_pred (numpy.ndarray) – Predictions, the algorithms will be identified with alg-k where k=1 is the first argument included in
y_pred.kwargs (numpy.ndarray) – Predictions, the algorithms will be identified using the keyword
num_samples (int) – Number of bootstrap samples, default=500.
n_jobs (int) – Number of jobs to compute the statistic, default=-1 corresponding to use all threads.
use_tqdm (bool) – Whether to use tqdm.tqdm to visualize the progress, default=True
log_loss
- precision_score(y_true, *y_pred, labels=None, pos_label=1, average='binary', sample_weight=None, zero_division='warn', num_samples: int = 500, n_jobs: int = -1, use_tqdm=True, **kwargs)[source]
Perfwithprecision_scoreasscore_func.The parameters not described can be found inprecision_score.- Parameters:
y_true (numpy.ndarray or pandas.DataFrame) – True measurement or could be a pandas.DataFrame where column label ‘y’ corresponds to the true measurement.
y_pred (numpy.ndarray) – Predictions, the algorithms will be identified with alg-k where k=1 is the first argument included in
y_pred.kwargs (numpy.ndarray) – Predictions, the algorithms will be identified using the keyword
num_samples (int) – Number of bootstrap samples, default=500.
n_jobs (int) – Number of jobs to compute the statistic, default=-1 corresponding to use all threads.
use_tqdm (bool) – Whether to use tqdm.tqdm to visualize the progress, default=True
precision_score
- recall_score(y_true, *y_pred, labels=None, pos_label=1, average='binary', sample_weight=None, zero_division='warn', num_samples: int = 500, n_jobs: int = -1, use_tqdm=True, **kwargs)[source]
Perfwithrecall_scoreasscore_func.The parameters not described can be found inrecall_score.- Parameters:
y_true (numpy.ndarray or pandas.DataFrame) – True measurement or could be a pandas.DataFrame where column label ‘y’ corresponds to the true measurement.
y_pred (numpy.ndarray) – Predictions, the algorithms will be identified with alg-k where k=1 is the first argument included in
y_pred.kwargs (numpy.ndarray) – Predictions, the algorithms will be identified using the keyword
num_samples (int) – Number of bootstrap samples, default=500.
n_jobs (int) – Number of jobs to compute the statistic, default=-1 corresponding to use all threads.
use_tqdm (bool) – Whether to use tqdm.tqdm to visualize the progress, default=True
recall_score
- jaccard_score(y_true, *y_pred, labels=None, pos_label=1, average='binary', sample_weight=None, zero_division='warn', num_samples: int = 500, n_jobs: int = -1, use_tqdm=True, **kwargs)[source]
Perfwithjaccard_scoreasscore_func.The parameters not described can be found injaccard_score.- Parameters:
y_true (numpy.ndarray or pandas.DataFrame) – True measurement or could be a pandas.DataFrame where column label ‘y’ corresponds to the true measurement.
y_pred (numpy.ndarray) – Predictions, the algorithms will be identified with alg-k where k=1 is the first argument included in
y_pred.kwargs (numpy.ndarray) – Predictions, the algorithms will be identified using the keyword
num_samples (int) – Number of bootstrap samples, default=500.
n_jobs (int) – Number of jobs to compute the statistic, default=-1 corresponding to use all threads.
use_tqdm (bool) – Whether to use tqdm.tqdm to visualize the progress, default=True
jaccard_score
- roc_auc_score(y_true, *y_score, average='macro', sample_weight=None, max_fpr=None, multi_class='raise', labels=None, num_samples: int = 500, n_jobs: int = -1, use_tqdm=True, **kwargs)[source]
Perfwithroc_auc_scoreasscore_func.The parameters not described can be found inroc_auc_score.- Parameters:
y_true (numpy.ndarray or pandas.DataFrame) – True measurement or could be a pandas.DataFrame where column label ‘y’ corresponds to the true measurement.
y_score (numpy.ndarray) – Predictions, the algorithms will be identified with alg-k where k=1 is the first argument included in
y_pred.kwargs (numpy.ndarray) – Predictions, the algorithms will be identified using the keyword
num_samples (int) – Number of bootstrap samples, default=500.
n_jobs (int) – Number of jobs to compute the statistic, default=-1 corresponding to use all threads.
use_tqdm (bool) – Whether to use tqdm.tqdm to visualize the progress, default=True
roc_auc_score
- d2_log_loss_score(y_true, *y_proba, sample_weight=None, labels=None, num_samples: int = 500, n_jobs: int = -1, use_tqdm=True, **kwargs)[source]
Perfwithd2_log_loss_scoreasscore_func.The parameters not described can be found ind2_log_loss_score.- Parameters:
y_true (numpy.ndarray or pandas.DataFrame) – True measurement or could be a pandas.DataFrame where column label ‘y’ corresponds to the true measurement.
y_proba (numpy.ndarray) – Predictions, the algorithms will be identified with alg-k where k=1 is the first argument included in
y_pred.kwargs (numpy.ndarray) – Predictions, the algorithms will be identified using the keyword
num_samples (int) – Number of bootstrap samples, default=500.
n_jobs (int) – Number of jobs to compute the statistic, default=-1 corresponding to use all threads.
use_tqdm (bool) – Whether to use tqdm.tqdm to visualize the progress, default=True
d2_log_loss_score
- explained_variance_score(y_true, *y_pred, sample_weight=None, multioutput='uniform_average', force_finite=True, num_samples: int = 500, n_jobs: int = -1, use_tqdm=True, **kwargs)[source]
Perfwithexplained_variance_scoreasscore_func.The parameters not described can be found inexplained_variance_score.- Parameters:
y_true (numpy.ndarray or pandas.DataFrame) – True measurement or could be a pandas.DataFrame where column label ‘y’ corresponds to the true measurement.
y_pred (numpy.ndarray) – Predictions, the algorithms will be identified with alg-k where k=1 is the first argument included in
y_pred.kwargs (numpy.ndarray) – Predictions, the algorithms will be identified using the keyword
num_samples (int) – Number of bootstrap samples, default=500.
n_jobs (int) – Number of jobs to compute the statistic, default=-1 corresponding to use all threads.
use_tqdm (bool) – Whether to use tqdm.tqdm to visualize the progress, default=True
explained_variance_score
- max_error(y_true, *y_pred, num_samples: int = 500, n_jobs: int = -1, use_tqdm=True, **kwargs)[source]
Perfwithmax_erroraserror_func.The parameters not described can be found inmax_error.- Parameters:
y_true (numpy.ndarray or pandas.DataFrame) – True measurement or could be a pandas.DataFrame where column label ‘y’ corresponds to the true measurement.
y_pred (numpy.ndarray) – Predictions, the algorithms will be identified with alg-k where k=1 is the first argument included in
y_pred.kwargs (numpy.ndarray) – Predictions, the algorithms will be identified using the keyword
num_samples (int) – Number of bootstrap samples, default=500.
n_jobs (int) – Number of jobs to compute the statistic, default=-1 corresponding to use all threads.
use_tqdm (bool) – Whether to use tqdm.tqdm to visualize the progress, default=True
max_error
- mean_absolute_error(y_true, *y_pred, sample_weight=None, multioutput='uniform_average', num_samples: int = 500, n_jobs: int = -1, use_tqdm=True, **kwargs)[source]
Perfwithmean_absolute_erroraserror_func.The parameters not described can be found inmean_absolute_error.- Parameters:
y_true (numpy.ndarray or pandas.DataFrame) – True measurement or could be a pandas.DataFrame where column label ‘y’ corresponds to the true measurement.
y_pred (numpy.ndarray) – Predictions, the algorithms will be identified with alg-k where k=1 is the first argument included in
y_pred.kwargs (numpy.ndarray) – Predictions, the algorithms will be identified using the keyword
num_samples (int) – Number of bootstrap samples, default=500.
n_jobs (int) – Number of jobs to compute the statistic, default=-1 corresponding to use all threads.
use_tqdm (bool) – Whether to use tqdm.tqdm to visualize the progress, default=True
mean_absolute_error
- mean_squared_error(y_true, *y_pred, sample_weight=None, multioutput='uniform_average', num_samples: int = 500, n_jobs: int = -1, use_tqdm=True, **kwargs)[source]
Perfwithmean_squared_erroraserror_func.The parameters not described can be found inmean_squared_error.- Parameters:
y_true (numpy.ndarray or pandas.DataFrame) – True measurement or could be a pandas.DataFrame where column label ‘y’ corresponds to the true measurement.
y_pred (numpy.ndarray) – Predictions, the algorithms will be identified with alg-k where k=1 is the first argument included in
y_pred.kwargs (numpy.ndarray) – Predictions, the algorithms will be identified using the keyword
num_samples (int) – Number of bootstrap samples, default=500.
n_jobs (int) – Number of jobs to compute the statistic, default=-1 corresponding to use all threads.
use_tqdm (bool) – Whether to use tqdm.tqdm to visualize the progress, default=True
mean_squared_error
- root_mean_squared_error(y_true, *y_pred, sample_weight=None, multioutput='uniform_average', num_samples: int = 500, n_jobs: int = -1, use_tqdm=True, **kwargs)[source]
Perfwithroot_mean_squared_erroraserror_func.The parameters not described can be found inroot_mean_squared_error.- Parameters:
y_true (numpy.ndarray or pandas.DataFrame) – True measurement or could be a pandas.DataFrame where column label ‘y’ corresponds to the true measurement.
y_pred (numpy.ndarray) – Predictions, the algorithms will be identified with alg-k where k=1 is the first argument included in
y_pred.kwargs (numpy.ndarray) – Predictions, the algorithms will be identified using the keyword
num_samples (int) – Number of bootstrap samples, default=500.
n_jobs (int) – Number of jobs to compute the statistic, default=-1 corresponding to use all threads.
use_tqdm (bool) – Whether to use tqdm.tqdm to visualize the progress, default=True
root_mean_squared_error
- mean_squared_log_error(y_true, *y_pred, sample_weight=None, multioutput='uniform_average', num_samples: int = 500, n_jobs: int = -1, use_tqdm=True, **kwargs)[source]
Perfwithmean_squared_log_erroraserror_func.The parameters not described can be found inmean_squared_log_error.- Parameters:
y_true (numpy.ndarray or pandas.DataFrame) – True measurement or could be a pandas.DataFrame where column label ‘y’ corresponds to the true measurement.
y_pred (numpy.ndarray) – Predictions, the algorithms will be identified with alg-k where k=1 is the first argument included in
y_pred.kwargs (numpy.ndarray) – Predictions, the algorithms will be identified using the keyword
num_samples (int) – Number of bootstrap samples, default=500.
n_jobs (int) – Number of jobs to compute the statistic, default=-1 corresponding to use all threads.
use_tqdm (bool) – Whether to use tqdm.tqdm to visualize the progress, default=True
mean_squared_log_error
- root_mean_squared_log_error(y_true, *y_pred, sample_weight=None, multioutput='uniform_average', num_samples: int = 500, n_jobs: int = -1, use_tqdm=True, **kwargs)[source]
Perfwithroot_mean_squared_log_erroraserror_func.The parameters not described can be found inroot_mean_squared_log_error.- Parameters:
y_true (numpy.ndarray or pandas.DataFrame) – True measurement or could be a pandas.DataFrame where column label ‘y’ corresponds to the true measurement.
y_pred (numpy.ndarray) – Predictions, the algorithms will be identified with alg-k where k=1 is the first argument included in
y_pred.kwargs (numpy.ndarray) – Predictions, the algorithms will be identified using the keyword
num_samples (int) – Number of bootstrap samples, default=500.
n_jobs (int) – Number of jobs to compute the statistic, default=-1 corresponding to use all threads.
use_tqdm (bool) – Whether to use tqdm.tqdm to visualize the progress, default=True
root_mean_squared_log_error
- median_absolute_error(y_true, *y_pred, sample_weight=None, multioutput='uniform_average', num_samples: int = 500, n_jobs: int = -1, use_tqdm=True, **kwargs)[source]
Perfwithmedian_absolute_erroraserror_func.The parameters not described can be found inmedian_absolute_error.- Parameters:
y_true (numpy.ndarray or pandas.DataFrame) – True measurement or could be a pandas.DataFrame where column label ‘y’ corresponds to the true measurement.
y_pred (numpy.ndarray) – Predictions, the algorithms will be identified with alg-k where k=1 is the first argument included in
y_pred.kwargs (numpy.ndarray) – Predictions, the algorithms will be identified using the keyword
num_samples (int) – Number of bootstrap samples, default=500.
n_jobs (int) – Number of jobs to compute the statistic, default=-1 corresponding to use all threads.
use_tqdm (bool) – Whether to use tqdm.tqdm to visualize the progress, default=True
median_absolute_error
- r2_score(y_true, *y_pred, sample_weight=None, multioutput='uniform_average', force_finite=True, num_samples: int = 500, n_jobs: int = -1, use_tqdm=True, **kwargs)[source]
Perfwithr2_scoreasscore_func.The parameters not described can be found inr2_score.- Parameters:
y_true (numpy.ndarray or pandas.DataFrame) – True measurement or could be a pandas.DataFrame where column label ‘y’ corresponds to the true measurement.
y_pred (numpy.ndarray) – Predictions, the algorithms will be identified with alg-k where k=1 is the first argument included in
y_pred.kwargs (numpy.ndarray) – Predictions, the algorithms will be identified using the keyword
num_samples (int) – Number of bootstrap samples, default=500.
n_jobs (int) – Number of jobs to compute the statistic, default=-1 corresponding to use all threads.
use_tqdm (bool) – Whether to use tqdm.tqdm to visualize the progress, default=True
r2_score
- mean_poisson_deviance(y_true, *y_pred, sample_weight=None, num_samples: int = 500, n_jobs: int = -1, use_tqdm=True, **kwargs)[source]
Perfwithmean_poisson_devianceaserror_func.The parameters not described can be found inmean_poisson_deviance.- Parameters:
y_true (numpy.ndarray or pandas.DataFrame) – True measurement or could be a pandas.DataFrame where column label ‘y’ corresponds to the true measurement.
y_pred (numpy.ndarray) – Predictions, the algorithms will be identified with alg-k where k=1 is the first argument included in
y_pred.kwargs (numpy.ndarray) – Predictions, the algorithms will be identified using the keyword
num_samples (int) – Number of bootstrap samples, default=500.
n_jobs (int) – Number of jobs to compute the statistic, default=-1 corresponding to use all threads.
use_tqdm (bool) – Whether to use tqdm.tqdm to visualize the progress, default=True
mean_poisson_deviance
- mean_gamma_deviance(y_true, *y_pred, sample_weight=None, num_samples: int = 500, n_jobs: int = -1, use_tqdm=True, **kwargs)[source]
Perfwithmean_gamma_devianceaserror_func.The parameters not described can be found inmean_gamma_deviance.- Parameters:
y_true (numpy.ndarray or pandas.DataFrame) – True measurement or could be a pandas.DataFrame where column label ‘y’ corresponds to the true measurement.
y_pred (numpy.ndarray) – Predictions, the algorithms will be identified with alg-k where k=1 is the first argument included in
y_pred.kwargs (numpy.ndarray) – Predictions, the algorithms will be identified using the keyword
num_samples (int) – Number of bootstrap samples, default=500.
n_jobs (int) – Number of jobs to compute the statistic, default=-1 corresponding to use all threads.
use_tqdm (bool) – Whether to use tqdm.tqdm to visualize the progress, default=True
mean_gamma_deviance
- mean_absolute_percentage_error(y_true, *y_pred, sample_weight=None, multioutput='uniform_average', num_samples: int = 500, n_jobs: int = -1, use_tqdm=True, **kwargs)[source]
Perfwithmean_absolute_percentage_erroraserror_func.The parameters not described can be found inmean_absolute_percentage_error.- Parameters:
y_true (numpy.ndarray or pandas.DataFrame) – True measurement or could be a pandas.DataFrame where column label ‘y’ corresponds to the true measurement.
y_pred (numpy.ndarray) – Predictions, the algorithms will be identified with alg-k where k=1 is the first argument included in
y_pred.kwargs (numpy.ndarray) – Predictions, the algorithms will be identified using the keyword
num_samples (int) – Number of bootstrap samples, default=500.
n_jobs (int) – Number of jobs to compute the statistic, default=-1 corresponding to use all threads.
use_tqdm (bool) – Whether to use tqdm.tqdm to visualize the progress, default=True
mean_absolute_percentage_error
- d2_absolute_error_score(y_true, *y_pred, sample_weight=None, multioutput='uniform_average', num_samples: int = 500, n_jobs: int = -1, use_tqdm=True, **kwargs)[source]
Perfwithd2_absolute_error_scoreasscore_func.The parameters not described can be found ind2_absolute_error_score.- Parameters:
y_true (numpy.ndarray or pandas.DataFrame) – True measurement or could be a pandas.DataFrame where column label ‘y’ corresponds to the true measurement.
y_pred (numpy.ndarray) – Predictions, the algorithms will be identified with alg-k where k=1 is the first argument included in
y_pred.kwargs (numpy.ndarray) – Predictions, the algorithms will be identified using the keyword
num_samples (int) – Number of bootstrap samples, default=500.
n_jobs (int) – Number of jobs to compute the statistic, default=-1 corresponding to use all threads.
use_tqdm (bool) – Whether to use tqdm.tqdm to visualize the progress, default=True
d2_absolute_error_score
